What is a Paired t Test?
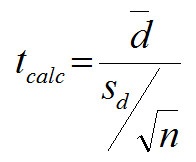
A Third type of a Two Sample t-Test is the Paired t Test. This test is used when the two populations are dependent of each other, so each data point from one distribution corresponds to a data point in the other distribution. When using a paired t test, the test statistic is calculated using the average difference between the data pairs, the standard deviation of the differences, and the sample size of either population.
Test Statistic
Where:

- d is the difference between each pair of data
- is the average of d
- n is the sample size of either population of interest
Critical Value
- tcrit is the t value in a Student’s t distribution with the predetermined significance level α and degrees of freedom (n – 1).
- tcrit values for a two-sided and a one-sided t-test with the same significance level α and degrees of freedom (n – 1) are different.
The critical t is looked up using the significance level alpha and degrees of freedom (n – 1).
Use Minitab to Run a Paired T Test
Case study: We are interested to know whether the average salaries ($1000/yr.) of male and female professors at the same university are the same.
Data File: “Paired T Test” tab in “Sample Data.xlsx”
The data were randomly collected from 22 universities. For each university, the salaries of male and female professors were randomly selected.
- Null Hypothesis(H0): μmale – μfemale = 0
- Alternative Hypothesis(Ha): μmale – μfemale ≠ 0
Step 1: Create a new column for the difference between data sets, name it “Difference.”
- Right click on the newly-generated column, “Difference.”
- Select “Formulas” and then “Assign Formula to Column.”
- A new window named “Assign Formula to C3 (Difference)” pops up.
- Enter “‘MALES’-‘FEMALES’ ” into the box right below “Expression.”

- Click “OK.”
- The values would appear in the column “Difference.”

Step 2: Test whether the difference is normally distributed.
- Null Hypothesis(H0): The difference between two data sets is normally distributed.
- Alternative Hypothesis(Ha): The difference between two data sets is not normally distributed.
- Click Stat → Basic Statistics → Normality Test.
- A new window named “Normality Test” pops up.
- Select “Difference” as the “Variable.”

- Click “OK.”
- The normality test results would appear in the new window.

The p-value of the normality test is 0.287, greater than the alpha level (0.05), so we fail to reject the null hypothesis and we claim that the difference is normally distributed. When the difference is not normally distributed, we need other hypothesis testing methods.
Step 3: Run the paired t-test to compare the means of two dependent data sets.
- Click Stat → Basic Statistics → Paired t.
- A new window named “Paired t (Test and Confidence Interval)” pops up.
- Click in the blank box right next to “First Sample” and the three columns names appear in the list box on the left.
- Select “MALES” as “First Sample.”
- Select “FEMALES” as “Second Sample.”

- Click “OK.”
- The paired t-test results appear in the session window.

Model summary: The p-value of the paired t-test is 0.213, greater than the alpha level (0.05), so we fail to reject the null hypothesis and we claim that there is no statistically significant difference between the salaries of male and those of female professors. Because the p-value is higher than 0.05, we again fail to reject the null hypothesis, meaning that there is no statistically significant difference between the salaries of male and female professors.


Comments are closed.